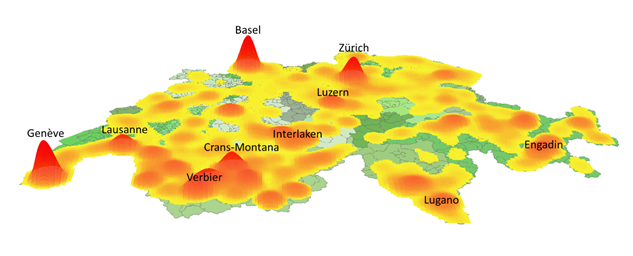
3D Mapping of the Airbnb phenomenon in Switzerland
AirbnbExplosive growth in Valais
Explosive growth in Valais
Regularly measured by the Valais Tourism Observatory (www.tourobs.ch), the increasing popularity of Airbnb does not betray itself, both at the national and regional level (please see our analysis of September, 2016: in German or French).
Our last survey was conducted on December 9th, 2016 for the canton of Valais (a main tourism region in Switzerland), counting a total of 3,650 Airbnb listings. The monitoring established since October, 2014 testifies of the striking evolution of Airbnb in the canton of Valais, with:
- The phenomenon increases: 419 % increase from October, 2014 until December, 2016!
- The phenomenon accelerates: 38 % increase in 6 months, from June until December, 2016!
- Airbnb now represents the equivalent of 56 % of hotel bed offer in Valais.
First legal constraints in big cities
The impressive rise of the Airbnb phenomenon is an increasing threat for the traditional tourism sector as this powerful leader of shared accommodation between private individuals will expand its services. As a matter of fact, Airbnb aspires to become a hub encompassing the entire traveler journey, not only supplying housing but also “experiences”, for example by planning tourist activities or shopping outings.
Major cities in Europe (Amsterdam, Barcelona, Paris, etc.) must confront the success of Airbnb, and gradually adopt regulations framing the activities of the popular platform. Legal battles are undertaken; quite recently, the city of New York implemented a regulation imposing a collaboration from Airbnb to eliminate from its platform all listings, that are not conform to the city’s legislation.
A 3D mapping of the phenomenon in Switzerland: Airbnb compared to the hotel industry
In this context, the Valais Tourism Observatory has created a series of 3D maps to illustrate the influence of Airbnb on the Swiss market, with the aim of comparing the phenomenon with the offer of classic hotel accommodation. The mapped information is based, on one hand, on the data extracted from our most recent study regarding Airbnb (evaluating its state at the end of June, 2016) and on the other hand, on the data of www.swisshoteldata.ch. The Swiss Hotel Association which manages this website has put at our disposal basic data (coordinates and number of beds) of 3,715 Swiss hotels.
How to read these 3D maps?
The 3D topography in the maps represents the offer of accommodations in terms of number of beds. The color scaling from red to yellow relates to the Airbnb’s offer (48,198 beds in 18,494 establishments in Switzerland) while the colors scaling from blue to violet concern the hotel supply (approx. 220,000 beds in more than 3,700 hotels).
Three "champions" in Switzerland: Geneva, Basel, and Zurich
At first sight, we notice certain peaks of accommodation as well as more scattered areas. This reflects the varied accommodation capacity according to the region. Three “champions” can clearly be distinguished (Geneva, Basel, and Zurich) followed by a “class 2” (in blue on the map, for example Zermatt or Lausanne). As one of the “champions”, Basel distinguishes itself by being the only site where the Airbnb supply is almost equivalent to that of hotels. There is a noticeable margin for growth in the other locations.
Valais distinguishes itself: Airbnb tends to occupy regions where the hotel industry is weaker.
Notably, peaks (Airbnb and hotels) are located in the same areas everywhere in Switzerland, except in Valais where Airbnb prevails, for example in Verbier, Nendaz, and Crans-Montana, but not in Zermatt.
The explanation is to be found in the importance of the self-accommodation sector (second homes, vacation homes and chalets), which is significant in Verbier, Nendaz, and Crans-Montana, but less dominant in Zermatt. In Valais, both types of accommodation (Airbnb and the hotels) seem to coexist as Airbnb tends to occupy areas where the hotel offer is weak.
A different scenario in Geneva where the competition of Airbnb is apparent
In Geneva, we can observe that the accommodation establishments (hotels and Airbnb) are primarily organized around the bay, despite some exceptions. Hotels are more centrally located than the accommodations offered by Airbnb. In addition, it turns out that Airbnb tends to occupy three key districts: Eaux-Vives, Pâquis and Plainpalais. It is particularly interesting to note that outside of the city center of Geneva and the bay, the canton is rather deserted of an Airbnb supply.
Methodological notes
We used the method of geographical smoothing to represent the supply (by using the formula of Silverman). The geographical smoothing method consists of representing not the value observed on a given territory, but a weighted average of the surrounded values observed.
It is essential to be cautious to the change of scale between the maps; different parameters are employed for the cantonal and the national Swiss maps. The size of the window of convolution depends on the size of the territory, and singular cantons are smaller than Switzerland. Therefore, one pixel of 900m is employed for the entire Swiss maps and a pixel of 50m for the cantonal maps.
The figurative in nuanced green for the municipal bottom presents no further information, it increases the visibility of the municipal pavement.


